24/06/2026
Map. Cheese. Cheese Map!
The need to visualize everything might be consuming me.
While Türkiye might not be the biggest cheese producer or have the vast variety of France, it’s still important to map our cultural treasures.
I scraped Wikipedia for text and images of the cheeses. Then I used the Gemini API’s embedding model to compare the cheeses to one another and obtain a similarity matrix. It didn’t work exactly as intended because regional names overlap so much, but it’s still a good starting point. Currently, I use regex to determine which province a cheese is from and which ingredients are used. The texture is also collected that way.
In the future, I want to use an LLM to generate structured 250- to 500-word summaries from grounded data so these embeddings work even better. Right now, some cheeses lack information, while the ones with long summaries tend to score too similarly.
Anyway, you can check it out here or just below:
Update: I’ve now generated summaries using Google’s search tool to find the texture, taste, ingredients, production steps, and origin for every single cheese in my dataset. My goal was to create a balanced summary that encapsulates every aspect of a cheese without overemphasizing any single trait. If you’re curious about the UMAP version of the embeddings, check it out here or right here:
Did I miss your hometown’s famous cheese?
Just send me an angry email. :^)
Other Mapping & Data Projects
Here is a short summary of the other projects I’ve been working on in the meantime:
VatanUgruna.com - A site for fallen soldiers and veterans of Türkiye.
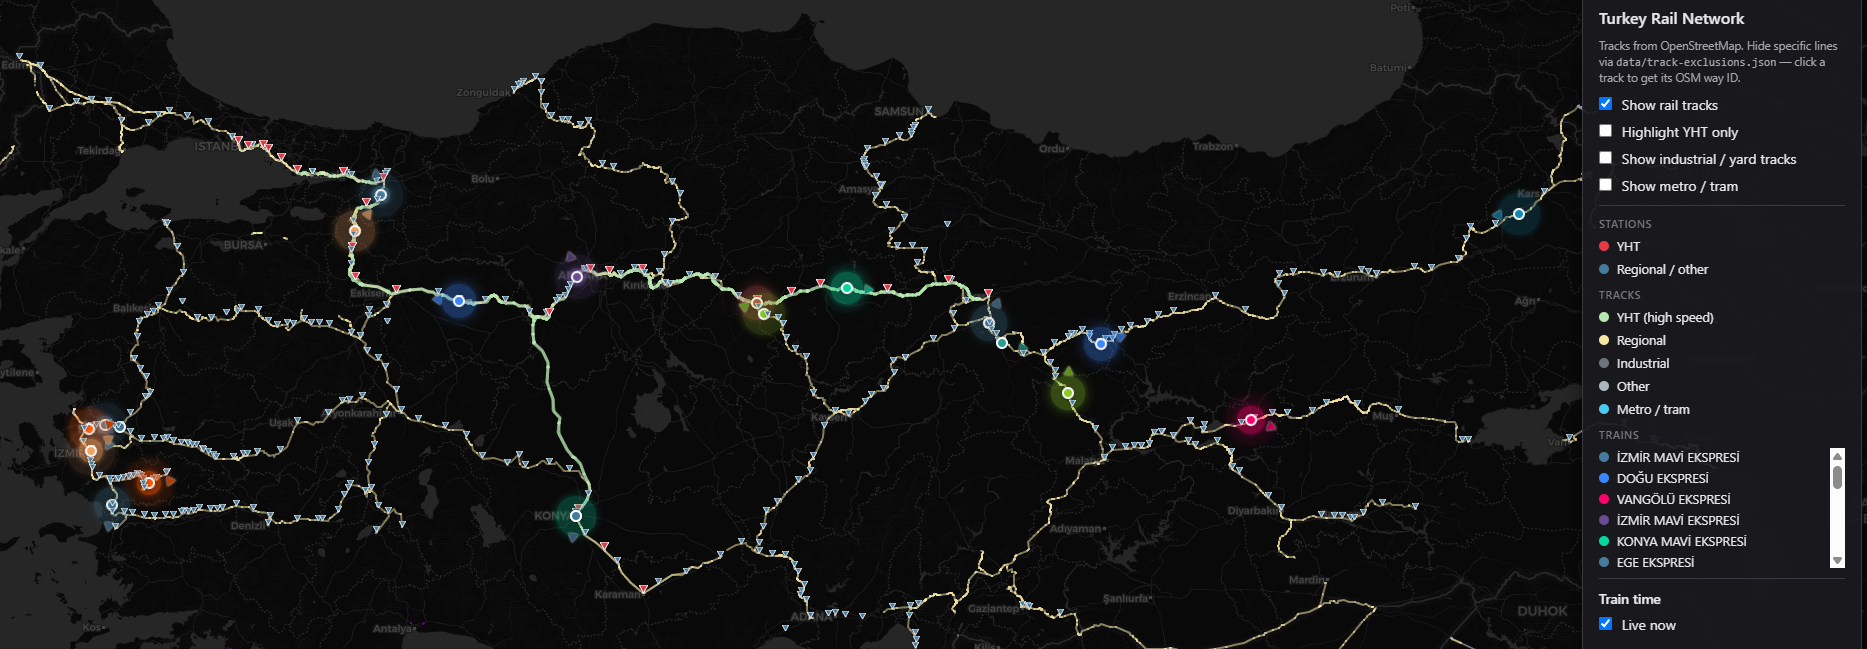
Real-time Turkish Railways map. - A map to visually track where Turkish Railways’ trains are currently located. Currently in the polishing stage.
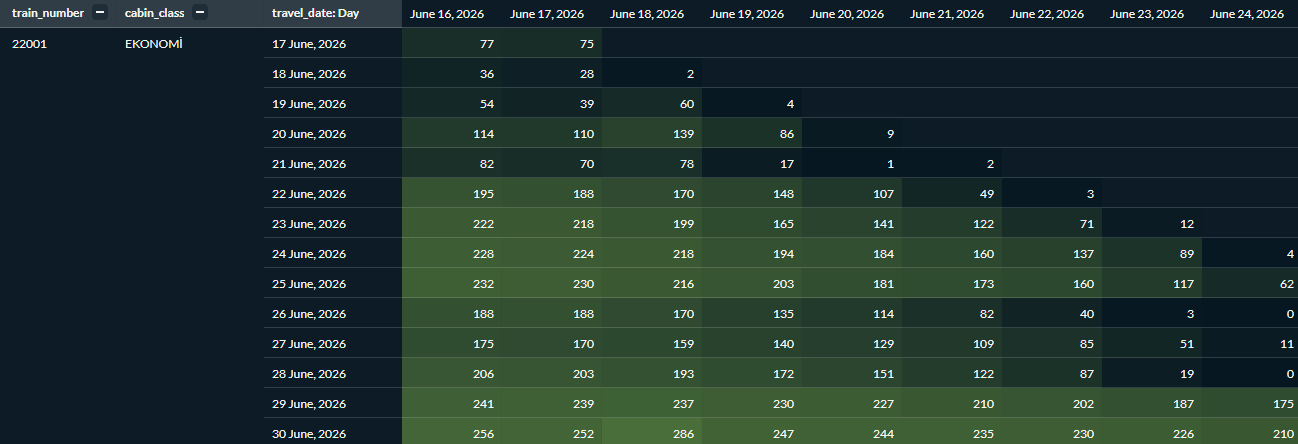
- Turkish railways availability analysis - Speaking of Turkish Railways, I’m an avid user of trains. Of course it’s really hard to find a ticket sometimes. I really wanted to analyze how people were behaving and their purchasing habits. The data is much more granular than what you see below. I’ll write a separate blog post about my findings, so stay tuned. :^)
Stargazing map. - Wanted to see if I could build a stargazing heatmap using weather forecasts and NASA’s luminosity overlay. It turns out converting luminosity to the Bortle Scale is very inconsistent. Discontinued.
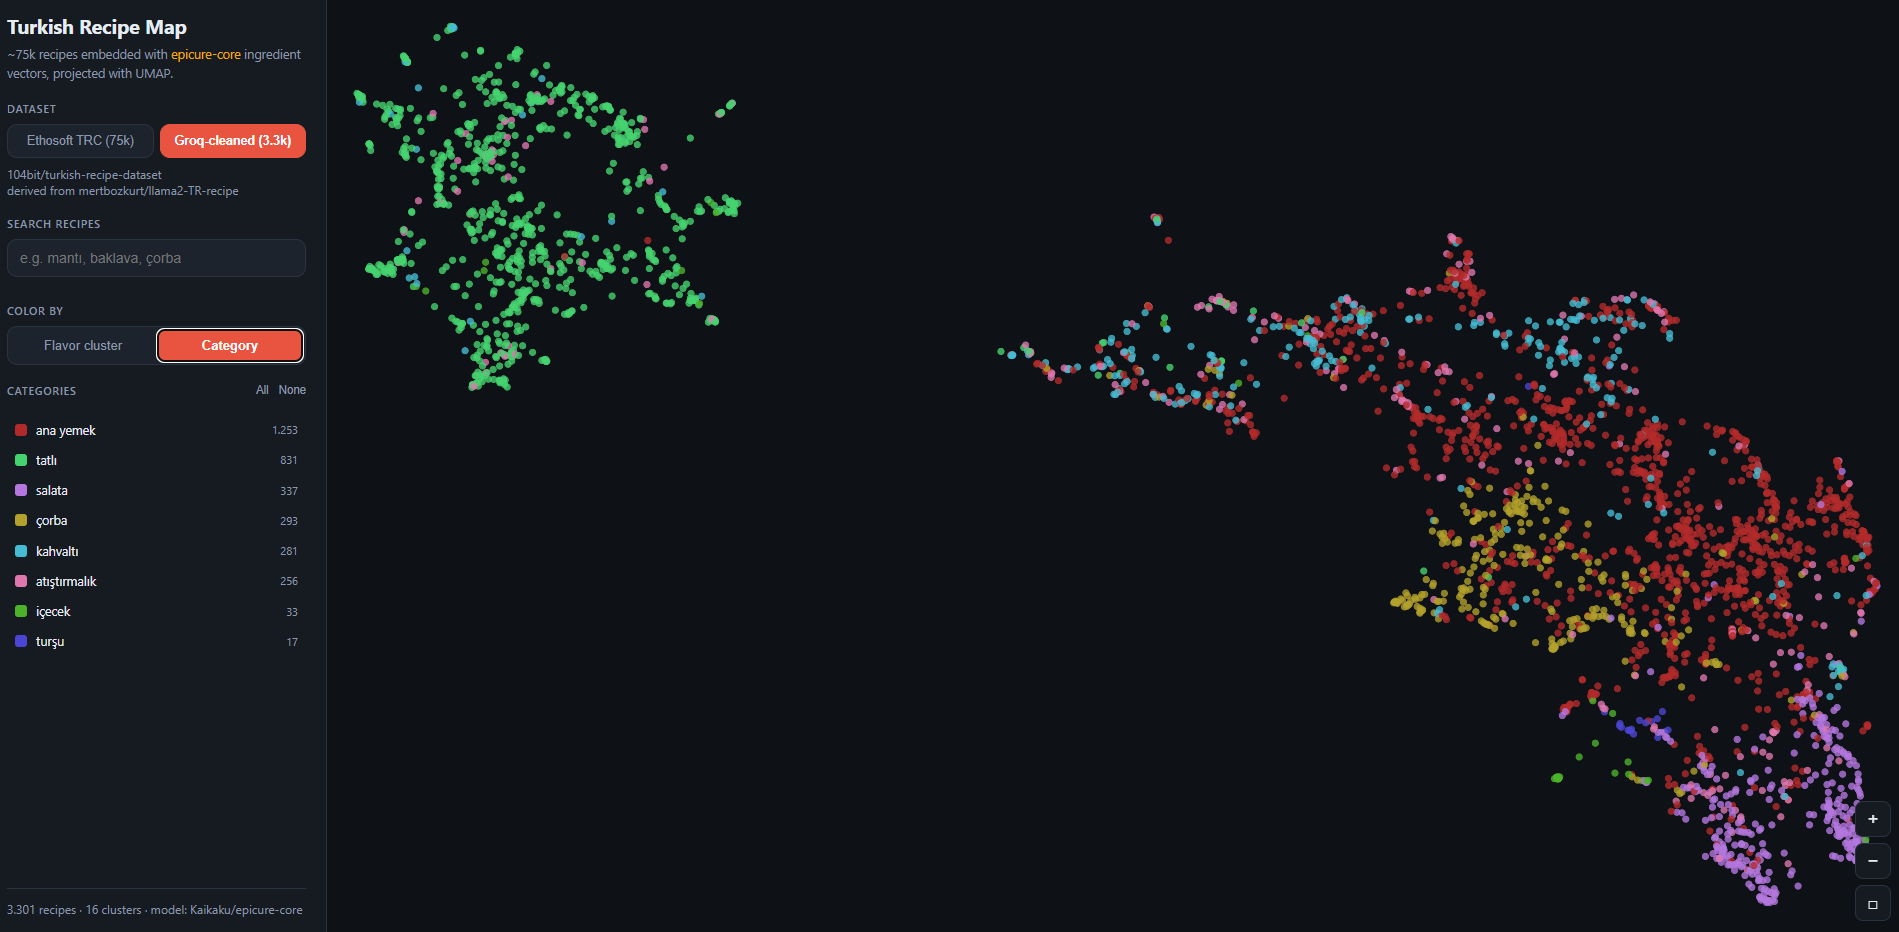
Turkish cuisine taste map. - A new embedding model dropped for food and taste called Epicure. So naturally, I wanted to test it on Turkish cuisine and map all of the Turkish food. I used big recipe datasets for this but I think a curated and specific list of recipes would be much better because I can see 5 distinct “un kurabiyesi” (flour cookie) recipes that use different ingredients and got UMAPped to entirely different regions—weird.
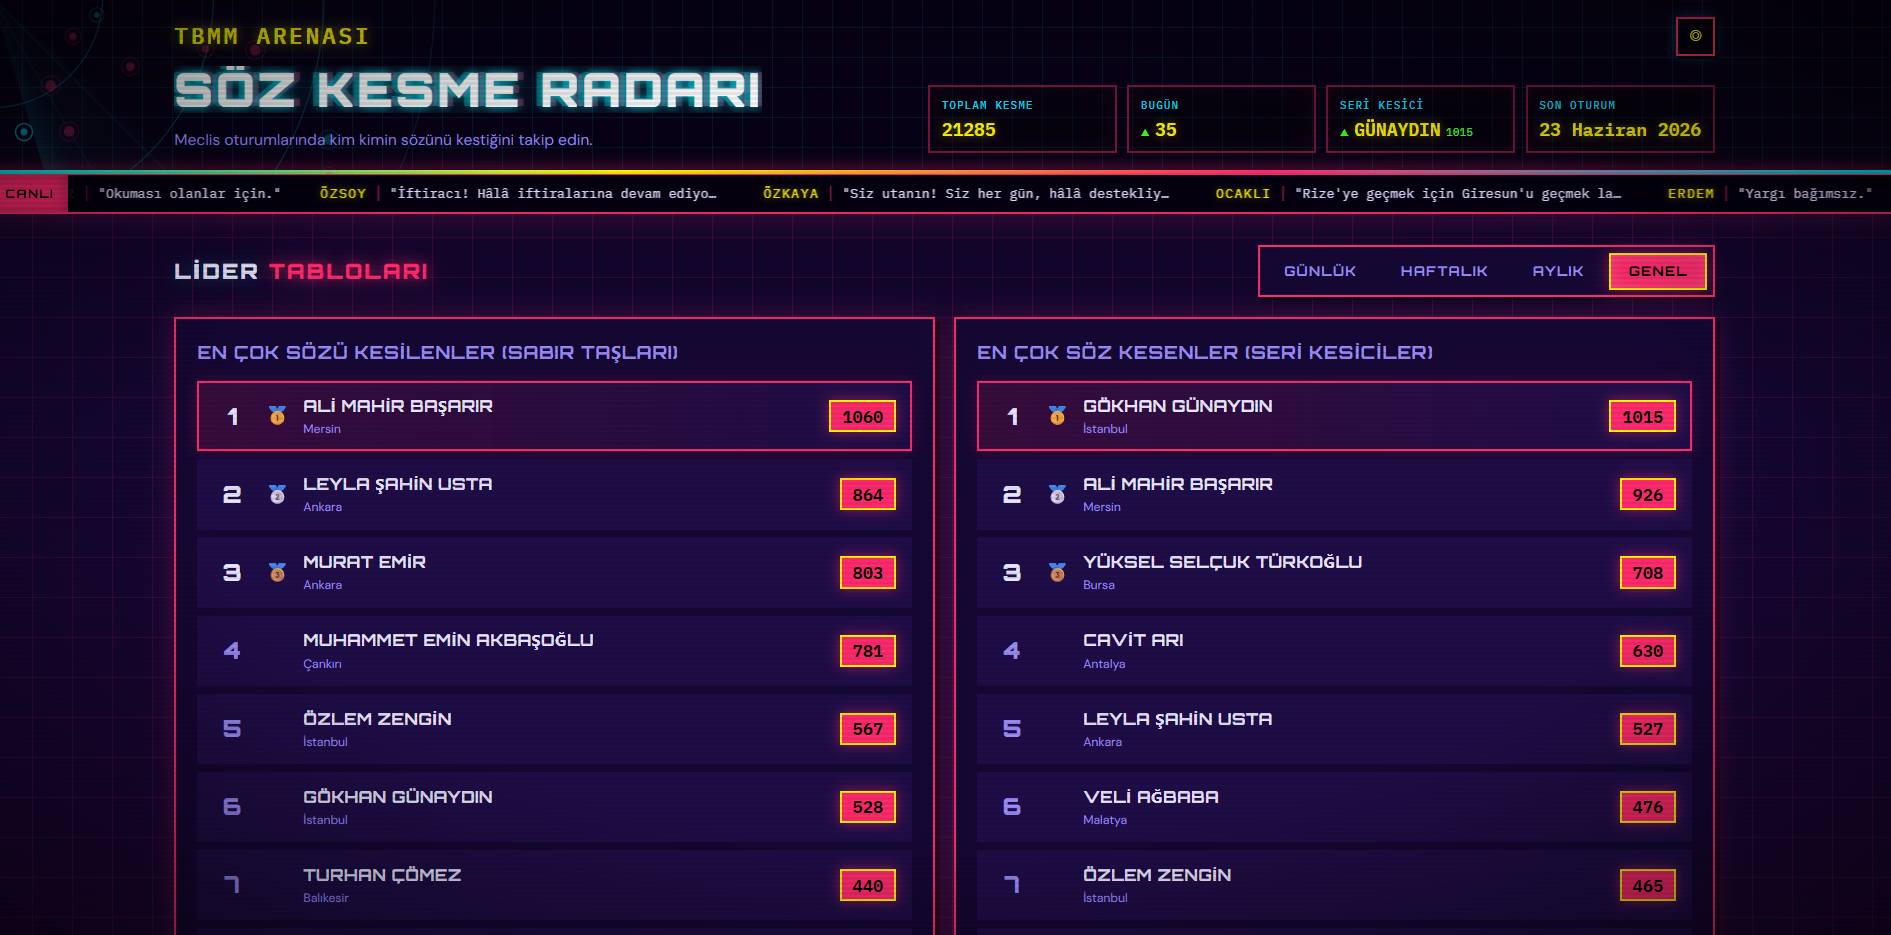
- Turkish parliament interruptions scoreboard. - The Turkish parliament releases daily transcripts of their hearings. If an MP is interrupted during a speech, the scribes also save the interrupter’s message, name, party, etc. A leaderboard was begging to be made! Proud to say I didn’t use any AI to calculate the statistics.
Turkish GroundNews. - I love the concept of GroundNews, where they curate a specific story and report on which news outlets covered it and in what way. It’s great to gain new perspectives and clearly see the political “no touch” zones for every faction when major headlines hit. This is still a work in progress so I can’t even show a screenshot for now. :^)
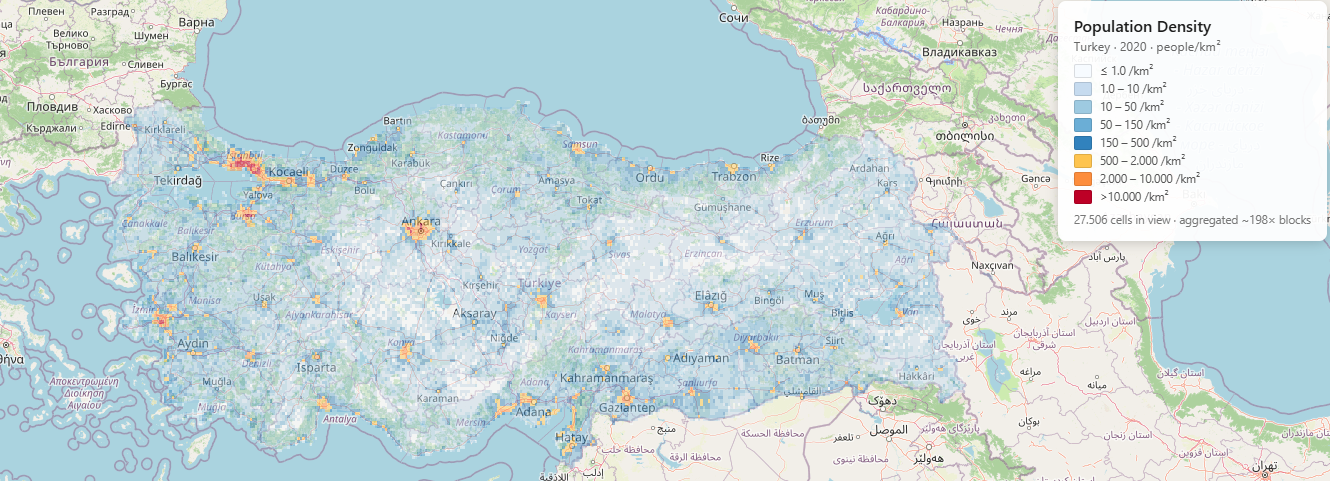
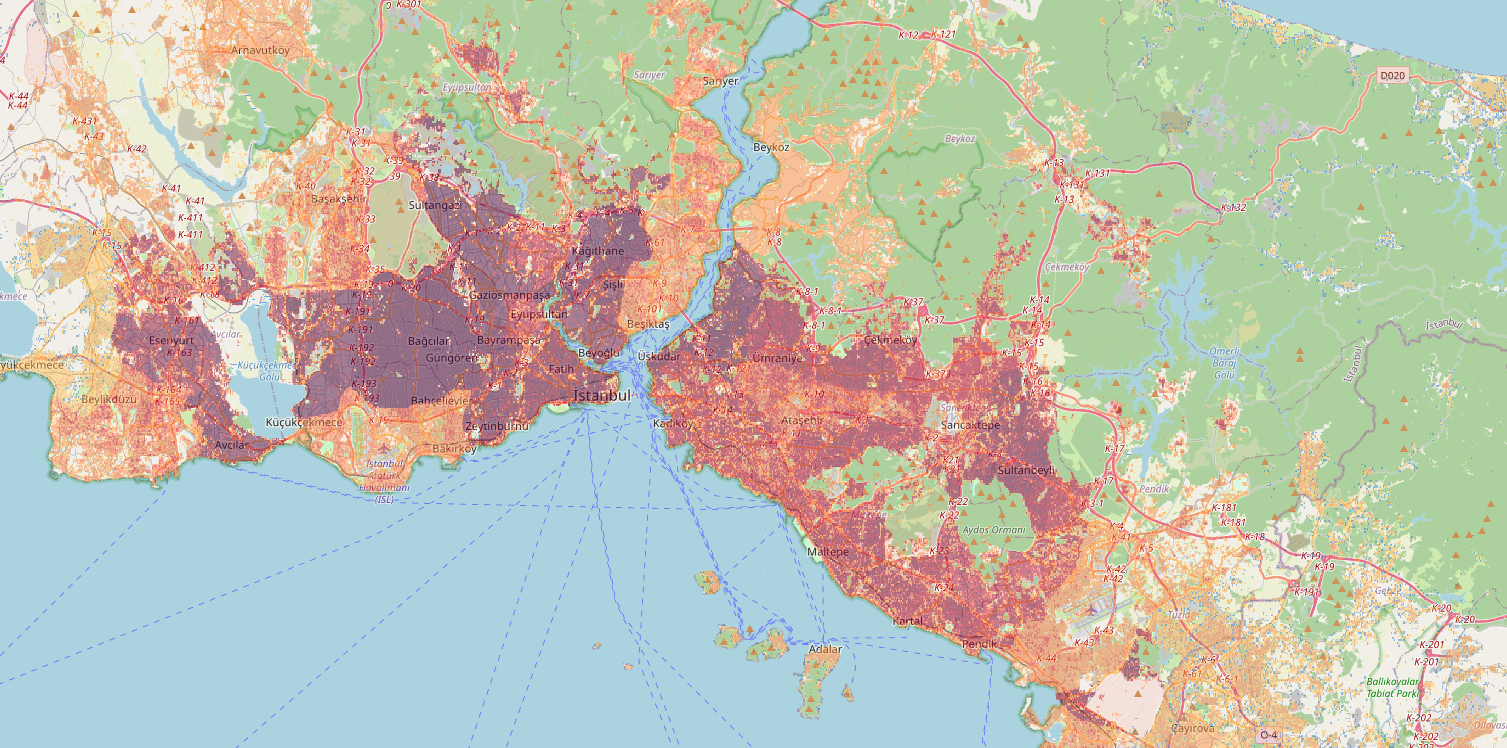
Türkiye population density map. - This will be a base for other projects to come. I know that Starbucks specifically chooses new locations based on population density because no one wants to walk 20 minutes for a coffee in Manhattan. I wondered how the Turkish national supermarket chains choose their locations. This will also be a baseline to calculate opportunities for barbers, plumbers, petrol stations, etc. It will also be easy to spot “opportunity”! The only data I could find was from Meta’s AI research and it was really choppy. It’s also very biased; I believe it uses user data activity and the population count for municipalities and it sometimes messes things up. I don’t think there are many real-world examples of such sudden, sharp spikes in population density. You usually don’t find skyscrapers right next to quiet villas, right? Anyways, I’ll make a separate post for this too!